MicroView Quick Reference Guide
Getting Help
MicroView has context-sensitive help attached to most dialogs and windows, including the main MicroView window. Press F1, or h at any time to view the MicroView quick-reference guide. Additional MicroView support can be obtained through the sourceforge forum, or by email: info@parallax-innovations.com.
Launching MicroView
Windows
Start MicroView by performing one of the following steps:
- Double-click the icon of any VFF image file from within Window’s Explorer or any file browser. MicroView will be launched, and the selected image file will be automatically loaded.
- Double-click the MicroView Desktop Icon. The icon is optionally placed on the desktop during the installation of MicroView.
- Run MicroView by selecting it from the system Start menu. Select Start ‣ Programs ‣ Parallax Innovations ‣ MicroView ‣ MicroView.

Linux
When using MicroView under Linux, ensure X11 is installed, and an X session (e.g. KDE or Gnome) has been started. Start MicroView by:
- Running /opt/GEHC/bin/MicroView from an xterm, or similar console;
- Selecting Graphics ‣ MicroView from the system menu (applies to Gnome 2.6 desktops; KDE menu entries may differ slightly).
Mac OS X 10.3
The MicroView installation process will place a MicroView launcher in the Applications folder of the Finder application. Double-click on the black and white GE icon (Finder ‣ Applications ‣ MicroView) to start MicroView.
Screen Layout
Overview
By default, the MicroView display consists of an application toolbar on the far left side of the screen, a 3D image viewport in the center of the screen, and a column of three 2D viewports on the right side of the screen. It contains a menu at the top of the application window, Window and Level adjustment scrollbars at the bottom and status and progress indicator at the extreme bottom of the window. Finally, it contains an interaction palette just above the status bar, that contains buttons to toggle the behavior of mouse clicks and mouse motion in MicroView.

Modifying the Layout
Each viewport in MicroView can be individually maximized by double-clicking the left mouse button over the viewport. When in the maximized state, the display can be restored by double-clicking the left mouse button while continuing to position the mouse over the viewport. The display of individual viewports can be managed by selecting the appropriate entries under the Window menu as well.
The basic layout of MicroView can also be changed: Select Window ‣ Set Layout to 2-by-2 to display MicroView as a 2-by-2 grid of viewports. Select Window ‣ Set Layout to 1-by-3 to switch back to the default arrangement.

MicroView’s Toolbar
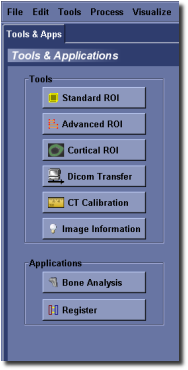
All of MicroView’s analysis tools are available through pull down menus. The most commonly used tools and applications are also available in the toolbar on the tab named “Tools & Apps”, at the left hand side of the main window. Whenever a tool is launched, a new tabbed window will appear in the toolbar. Each tool that is launched will be assigned a function key as a hotkey to bring that tool forward in the display. Press the hotkey F2 to select the first tool, F3 to select the second tool and so on. Pressing the X marker, in the right-hand corner of any tool’s tab will close and exit the tool. Pressing the ? marker will give context-sensitive help for the currently selected tool.
MicroView’s Interaction Palette
MicroView’s Interaction Palette contains convenient buttons that change the default mode of interaction with the application. By default, left (or primary) mouse clicks and drags within the 3D and 2D viewports changes the orientation of the image on the screen. By clicking on the appropriate button in the palette, this behavior can be changed to one of a number of other modes. Each mode can be additionally accessed by either a different mouse button, or combining shift and/or control with a mouse button, as described below. Using the Interaction Palette is particularly convenient in one or two mouse button environments.

MicroView’s Window and Level Controls
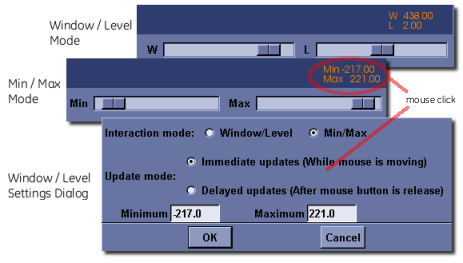
A common task, when viewing images with greater dynamic range than the capabilities of the viewing workstation, is the adjustment of image brightness and contrast. MicroView allows adjustment of grayscale image brightness by defining either an image’s window and level setting, or by defining the minimum and maximum grayscale values to display. Window and Level scrollbars are positioned at the bottom right side of MicroView’s main window, and can be interactively adjusted. The actual window and level values will be displayed in orange text in the bottom right corner of the 3D viewport. To switch to the min/max approach to adjusting image brightness and contrast, or to explicitly set image window and level values manually, simply click the left mouse button over the orange window/level text.
MicroView’s Visual Cues
MicroView provides a number of optional visual cues to assist with navigation within a 3D image. Most of the cues can be toggled on or off using MicroView’s Application Settings... menu entry.
- Volume border - a yellow border drawn around the entire extent of a 3D image. It assists with ROI selection and delineating the entire image.
- Axis labels - Axis (‘+X’, ‘-X’, ‘+Y’, ‘-Y’, ‘+Z’ and ‘-Z’) labels that move with the 3D image as it is rotated, zoomed or sliced.
- Plane intersection lines and triangular markers - red, green and blue lines/markers that indicate the intersection between planes. The display of the intersection lines can be toggled on/off; the triangular markers appear in each of the 2D views to highlight the location of the other two intersecting planes, and remain visible always.
- Plane borders - red, green and blue borders around each image plane, visible in both 2D and 3D viewports.
- 2D viewport border highlight - the x, y and z plane viewports are highlighted in red, green and blue, respectively.
Interacting with MicroView
Interacting with an Image
| Function | Description |
|---|---|
| Window and Level | Adjust Window and Level values to control image contrast and brightness. Window and Level values can be modified by using the scrollbars at the bottom of the MicroView window, or by selecting the window/level button on interaction palette, then click-and-dragging the left mouse button in any of MicroView’s viewports. The behavior and values of the window/level scrollbars can be adjusted by clicking on the Window/Level value display, in the bottom right corner of MicroView’s main window. Note Image contrast and brightness can also be controlled by selection of image minimum and maximum values. From MicroView’s Application Settings... menu entry, select the Misc tab, then select Use Min/Max for W/L control. Once selected, Window and Level scrollbars will be replaced by Min and Max scrollbars. |
| Image Rotate (3D) | Move the mouse in the 3D viewport while clicking the left mouse button to rotate the image. By default, the image will rotate about its center, while the mouse is dragged. However, clicking and dragging the left mouse button in the bottom portion of the 3D viewport will cause the image to rotate about an axis parallel to the viewing direction. |
| Image Pan | Click and drag the left mouse button, while pressing one of the shift keys to pan the image up, down, left or right. |
| Image Slice (3D) | Move the mouse over the center region of a slice plane. Drag the mouse, while pressing the middle mouse button to interactively slice through the image. Press the up or down Arrow key while the mouse is positioned over the center region of a slice plane in order to move the slice forwards or backwards in the image by one slice. Press the Page Up or Page Down key while the mouse is positioned over the center region of a slice plane in order to move the slice forwards or backwards in the image by ten slices. Press the Home and End keys to select the first and last image slice, respectively. |
| Image Slice Orientation (3D) | Position the mouse within the 3D viewport, on the edge, or corner of an image slice. Press the middle mouse button and drag the mouse up and down or left and right to rotate the orientation of the three slice planes within the image. When a corner is picked, the plane border color will change to red and the plane will rotate around the plane normal. When an edge is picked, the plane border color will change to cyan and the plane will rotate around the plane center line that parallels to the picked edge. |
| Image Zoom | Click and drag the right mousebutton up or down, to zoom in or out, respectively, on the image. |
| Maximize Viewport | Double-click the left mouse button while the mouse is positioned within any of MicroView’s four viewports to view only the selected viewport. MicroView will expand the selected viewport to occupy the entire working space of the MicroView window. Double-click on the viewport again to restore the original screen layout. |
| Reset all Viewports | Press the r key to restore slice selection and view orientation to their original settings. |
| Center Slice Intersection | Click the left mouse button, while pressing the Control key over the image, in any viewport. The intersection of the three image slices will move to the current location selected by the mouse position. |
Reading and Writing Image Files
Overview
MicroView supports a number of 2D and 3D file formats, both for image data, as well as surface geometry formats. A distinction is made between reading/writing image data and importing/exporting image data. This distinction is reflected in the entries listed in MicroView’s File menu. File reading and writing reads and writes precisely one file per operation (for instance, one might read a VFF image, then save it to a different filename in a different format).
File import and export operations are used to read and write, respectively, a sequence of 2D images. Image import is useful for loading a sequence of 2D images into a stacked 3D image. Image export is useful for splitting a 3D image up into a sequence of 2D slices.
Not all image formats supported in MicroView are available for all tasks: For instance, while exporting a 3D VFF image to a sequence of TIFF images is available, saving a 3D VFF image to TIFF format is not, since there is no 3D TIFF image format defined.
MicroView supports images in various bit depths, ranging from 8-bit to 32-bit formats. Not all file formats are available for image writing and image exporting, depending on the limitations of the individual format. Often, it is convenient to downsample image data to 8-bit, in order to maximize the number of file formats available.
MicroView supports images with varying numbers of channels in them. Both single channel (e.g. grayscale images) as well as multichannel (e.g. RGBA images) are supported. Currently, multichannel images are exclusively interpreted as RGB images.
The complete list of supported file formats is available in Appendix A of this document.
Loading an Image
Select File ‣ Open... from MicroView’s menu. Enter a filename, or locate a file in the file selector that appears on the screen.
Saving an Image
Select File ‣ Save As... from MicroView’s menu to save an image. Select the desired output image type in the drop down selector at the bottom of file selector dialog and enter a filename for the new image.
Saving a Screen Snapshot
Position the mouse over any 2D viewport, or the main 3D viewport, and press the t key to save a snapshot of the viewport to an image file. Select a filename and filetype, then hit OK to save the file.
Note
MicroView’s screenshot behavior has changed in a subtle way from previous releases: Saving a screen capture, while the mouse is over the 3D viewport, will save a snapshot of the entire collection of viewports, rather than just the 3D view. Maximize the 3D viewport before hitting the t key, in order to save just the 3D viewport.
Importing 2D image slices
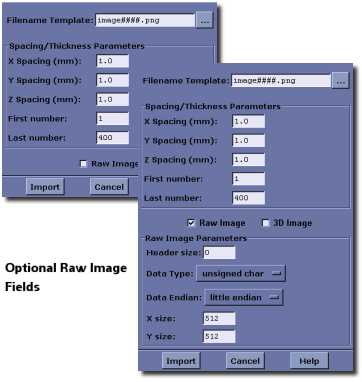
MicroView is capable of importing a sequence of 2D images, in a variety of common image formats, and assembling them into a 3D image. In order to accomplish this, each 2D image file must be named with a monotonically increasing ordinal.
Select File ‣ Image Import... from MicroView’s menu. Enter a filename template, in the format import-####.png, where “#” denotes characters that will be automatically replaced by index numbers. The button to the right of the template filename box can be used to select a file from a file browser. Enter the first index number and last index number in the appropriate entry boxes (e.g. if the template is chosen to be "import-##.gif" and first and last numbers are set to be 3 and 7, respectively, MicroView will attempt to load import-03.gif, import-04.gif... import-07.gif). Enter the spacing between image slices, in millimeters. Finally, press the Import button to import the sequence of images.
Importing Raw Images
MicroView can also import raw data in a variety of forms. Start by clicking the Raw Image button to display additional image import options. Specify the offset from the beginning of each file to the raw image data (in case an image header is present), the data type, byte ordering (for 16-bit image data) and the dimensions of the raw image data.
Note
MicroView can also import a single 3D raw image, if the 3D Image checkbox is checked. Instead of entering a sequence of file names, specify the entire filename, and enter x, y and z axis dimensions.
Exporting 2D image slices
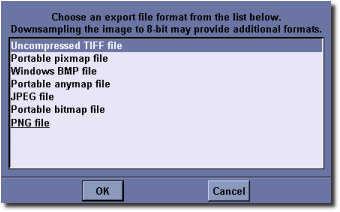
Select File ‣ Image Export... from MicroView’s menu. Choose an image format from the list provided. The list will vary depending on the image depth of the image you are saving. Next, select an output directory to write the image slice sequence into. MicroView will automatically write image slices to filenames with an extension that depends on the file format that you select, and a prefix of “export-” (e.g. export-0001.gif, ...).
MicroView Application Settings
Overview
Select Edit ‣ Application Settings... from MicroView’s menu, to change most of MicroView’s display options. Pop-up help is available for all options, simply by holding the mouse still over an option for a few seconds. Many of the options have corresponding keyboard shortcuts, which are displayed in square brackets to the right of the option. A description of each option is listed below, along with a table of corresponding keyboard shortcuts, where available.
Option Descriptions
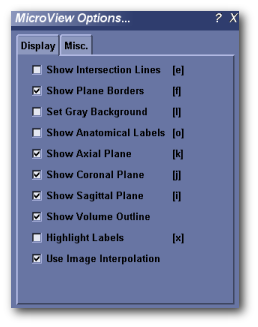
Display
- Show Intersection Lines [e] - Toggles the visibility of axes lines. X, Y and Z axes are displayed in red, green and blue, respectively.
- Show Plane Borders [f] - Toggles the visibility of the border around each image plane in both 3D and 2D viewports.
- Set Gray Background [l] - Toggles the display background color between black and medium gray.
- Show Axes Labels [o] - Toggles the display of the ‘+X’, ‘-X’, ‘+Y’, ‘-Y’, ‘+Z’ and ‘-Z’ axes labels in the 3D viewport.
- Show Axial Plane [k] - Toggles the display of the z-plane image.
- Show Coronal Plane [j] - Toggles the display of the y-plane image.
- Show Sagittal Plane [i] - Toggles the display of the x-plane image.
- Show Volume Outline - Toggles the display of the yellow border surrounding the full extent of the image in the 3D viewport.
- Highlight Label [x] - Toggles highlighting of all annotations visible on the 3D viewports. For some images turning on label highlighting will make annotations easier to read.
- Use Image Interpolation - If enabled, MicroView uses bilinear interpolation when displaying image data. When disabled, nearest neighbor interpolation is used instead.
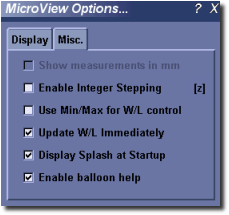
Misc.
- Show measurements in mm - When enabled, line and position measurements are made in millimeters. If disabled, or if not available for a particular image, measurements are made in pixels.
- Enable Integer Stepping - If enabled, MicroView will prevent the display of bilinearly interpolated slices between actual data slices.
- Use Min/Max for W/L control - If enabled, image contrast and brightness are controlled by selecting minimum and maximum image values to view. Values below the minimum will be set to black, values above the maximum will be set to white. If disabled, window and level settings are used instead.
- Update W/L Immediately - For slow displays, toggle this option off to have brightness and contrast adjustments take affect only when the mouse button is released, after dragging the window or level scrollbars. If enabled, window/level values will be updated immediately.
- Display Splash at Startup - If disabled, MicroView will avoid displaying a splash screen at program start up.
- Enable balloon help - If enabled, MicroView will display pop-up help text over all dialog controls and pop-up boxes when the mouse is stationary for a few seconds.
Managing 2D and 3D Regions of Interest (ROI)
Overview
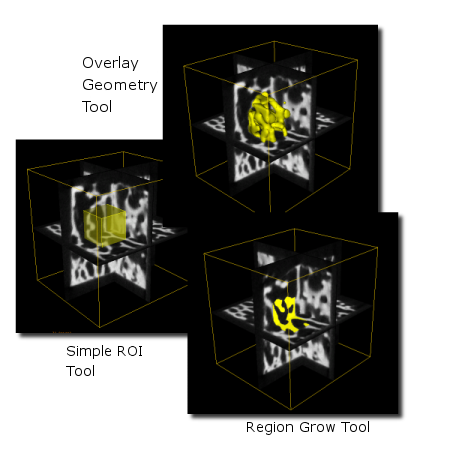
For many operations in MicroView, the starting point is the selection of a 2D or 3D region of interest (ROI). ROIs define the portion of the volume to be analyzed. For instance, an ROI can be created around a feature in an image in order to compute the mean and standard deviation of just that feature. The active ROI in MicroView is typically displayed in yellow to differentiate it from other surfaces and voxel highlight tools. The ROI may appear as a transparent yellow surface, or as a grouping of yellow voxels in the displayed image plane, depending on the tool used to generate the ROI. Currently, there are six tools that can be used to generate an ROI:
- The Standard ROI Tool - The 7 and 8, or alternatively Control7 and Control8 keys can be used to quickly define a rectangular ROI. You can use the “Standard ROI” menu button for greater control over the size and location of the ROI.
- The Histogram Plot Tool - This tool is used to plot histogram values of voxels contained within the active ROI, but can itself be used to select a range of voxels, by graylevel value, to serve as an ROI.
- The ROI Manager Tool - This tool replaces and enhances the functionality of the Overlay Geometry tool by enabling MicroView to store and manipulate more than one ROI in memory. File operations, combinations of multiple ROI and manipulation of the display characteristics are possible.
Once an ROI has been defined, a number of operations may be performed, including:
Image Blanking - Use the Delete and ShiftDelete to cut voxels inside, or outside of the given ROI, respectively. Select the value to fill in the appropriate region by selecting Process ‣ ROI Blanking ‣ Set Background Value from MicroView’s menu.
Simple and
Basic Bone Analysis
ROI Manager
This tool facilitates the use of multiple regions of interest (ROI) within MicroView. ROI are anonymous or unmanaged until added to the ROI Manager. Anonymous ROI are lost when you create new ROI. The ROI Manager can remember, display, activate, and apply Boolean operations to regions of interest.

An anonymous ROI is created using the :ref:`Region Grow <RegionGrowPlugin>` plugin.
Adding ROI
To have the ROI Manager remember the active ROI, click Add Current ROI and provide a name. The name you provided now appears in the ROI Objects list. The active ROI is now managed.
To save a ROI to disk, select an ROI from the ROI Objects list and click Save. The ROI Manager uses the VTK Image or vti format to store ROI on disk.
The ROI Manager supports loading of VTK Image files that are created using the save functionality above, as well as the file formats previously supported with the Overlay Geometry tool, such as VTK. To load an ROI from disk, click Load and locate the appropriate file.
To delete a managed ROI, select the ROI from the ROI Objects list and click Delete. Click Delete All to remove all ROI from the list.
Displaying ROI
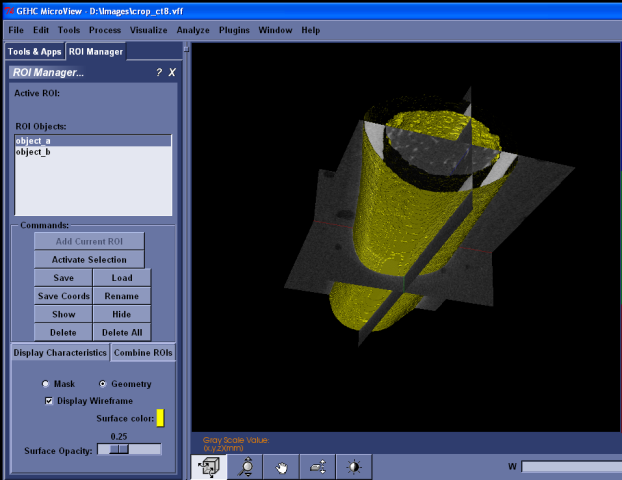
Displaying an ROI does not make an ROI active. That is, displayed ROI do not affect any of MicroView’s plugins or the calculations that they perform. To activate an ROI, see the next section ``Activating ROI’‘.
To display a managed ROI, select a ROI in the ROI Objects list. Now click Show. You can display multiple ROI simultaneously. To remove the ROI from the display, click Hide.
You have several options to control the visual presentation of the ROI. To view all displayed ROI as binary masks, choose the ``Mask’’ option. To view the displayed ROI as 3D objects, choose the ``Geometry’’ option.
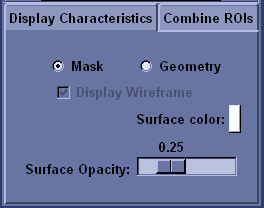
The Display Characteristics tab contains options that control the presentation of individual ROI. If you are using the ``Geometry’’ display option, then select ``Display Wireframe’’ to view a wireframe mesh of the ROI or de-select to view the ROI as a solid object.
The ``Surface color’’ and ``Surface Opacity’’ fields control the colour and translucency of the ROI respectively. When viewing ROI using the ``Geometry’’ option, the colour and opacity of each ROI can be controlled independently. When viewing ROI using the ``Mask’’ option, the colour of each ROI may be controlled independently, but the opacity affects all of the ROI currently viewed simultaneously.
Activating ROI
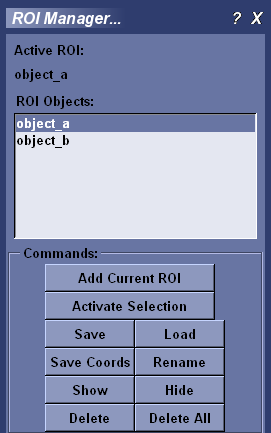
The active ROI affects MicroView’s plugins. To activate an ROI, select its name in the ROI Objects list and click Activate. Only one ROI can be active. The ``Active ROI’’ field at the top of the ROI manager displays the name of the active ROI. Creating a new ROI supplants the active ROI.
Applying Boolean Operations to ROI
You can apply Boolean operations to existing ROI to create new ROI. The figure illustrates the effects of the different Boolean operations: NOT inverts the ROI; OR combines two ROI; AND intersects two ROI; and XOR gives the ROIs’ respective unique points.
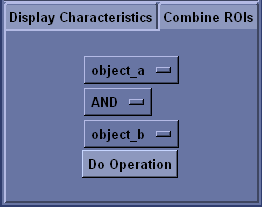
To apply a Boolean operation, open the Combine ROIs tab. Select the ROI and the operation you desire to perform. Note that NOT operates on a single ROI. Click Do Operation to execute the operation. The resulting ROI is added to the ROI Objects list.
Visualizing 3D Data
The ROI Manager’s 3D display capabilities can be used to create impressive graphical presentations of data. As an alternative to MicroView’s Volume Rendering plugin, you can display several ROI simultaneously using the ``Geometry’’ option. This is particularly advantageous when using the Movie Maker plugin: rendering the ROI is faster than the volume rendering.
Simple Analysis Tools
Point (1D)
At any time while the mouse cursor is over the volume, the coordinates and gray-scale value will appear in the bottom left-hand corner of the 3D viewport. You can change between displaying coordinates in mm or pixels, in MicroView’s application settings dialog (Edit ‣ Application Settings...).
Line (2D)
A line segment can be selected for analysis by performing the following steps:
- Position the mouse cursor over an image in any of the viewports.
- Press the 1 key to mark the beginning of the line.
- Press the 2 key to mark the end of the line.
- or -
- Select Edit ‣ Show Line to display a line in the center of the image immediately
Green and blue markers will be drawn in the 3D viewport, indicating the beginning and ending of the line, respectively. The marks can be dragged interactively about each viewport by selecting the marker using the middle button. Re-select the endpoints at any time by pressing either of the 1 and 2 keys. Clear the line by pressing the y key.
Once a line segmented has been selected, use any of the following hotkeys to perform a 2D analysis:
2D Keyboard Hotkeys
| HotKey | Result |
|---|---|
| a | Saves the end-points of the line tool, and gray-scale values measured along the selected line to a text file. |
| p | Plots the gray-scale values along the selected line. |
| y | Removes the line from the viewport. |
Volume (3D)
Select a 2D or 3D region of interest (ROI) using any of MicroView’s ROI tools. Once an ROI is selected, use any of the following hotkeys to perform 2D/3D analysis:
3D Keyboard Hotkeys
| Hot Key | Result |
|---|---|
| c | Removes the active ROI from the screen. |
| g | Plots the histogram of the gray-scale values within the ROI. |
| m | Calculates the mean and standard deviation of the gray-scale values within the ROI. |
| s | Saves the boundary coordinates of the standard ROI to a file. |
| v | Saves the ROI to an image file. |
| d | Saves the gray-scale values to a text file. Selection region must be two dimensional. |
| u | Saves the area to an image file (2D ROI selection only). |
| Delete | Sets voxel values, within the currently defined ROI to a user-defined value (defaults to zero). Use this key to mask out regions of an image. |
| Shift-Delete | Sets voxel values, outside the currently defined ROI to a user-defined value (defaults to zero). Use this key combination to mask out everything outside an ROI. |
Line Profile Window
Overview
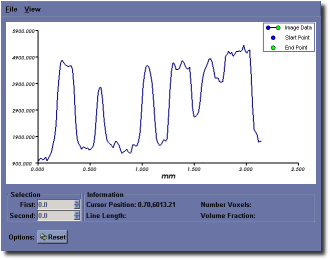
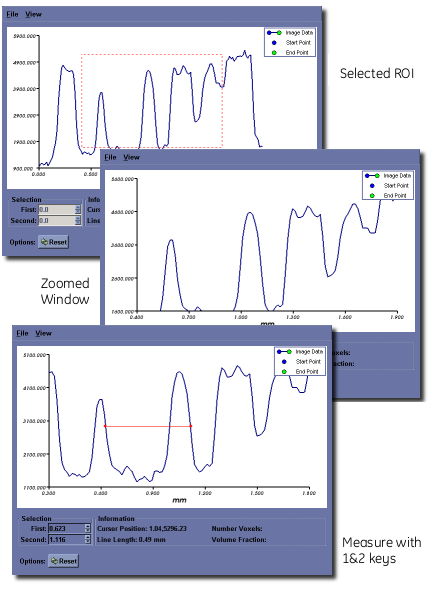
MicroView can plot a profile of pixel data along a user-defined line. First, select the start and end points of the line, then press the p key to plot the data profile.
Interacting with the Plot Window
Use the left mouse button to interactively click and drag a region of interest in order to zoom in on the plotted data. Multiple levels of zooming can be achieved by repeating the click-and-drag method. Zoom out by clicking with the right mouse button. Reset the plot window by clicking the Reset button at the bottom of the plot window, selecting View ‣ Reset, or by pressing the r key.
Optionally display symbols over each data point, by selecting View ‣ Symbols.
Measurements along the 2D pixel profile may be made by positioning the mouse cursor over a feature within the plot window and pressing the 1 key, then selecting a second feature and pressing the 2 key. A horizontal red line will be drawn between the two features. Once drawn, the endpoints can be moved, either by using the 1/2 key combination, or by adjusting the endpoint values in the editable text fields below the plot area. Mouse cursor position and selected line length are displayed in the bottom center of the plot window. This feature is particularly useful for measuring full-width half-max (FWHM) distances on peaks in a unbiased, systematic fashion.
Saving data
The plot window data can be exported to disk in one of two ways:
- Select File ‣ Save Data... to save the line profile to disk in a simple text format
- Select File ‣ Save Snapshot... to save a screen capture of the plot window to one of a number of common image file formats
Histogram Window
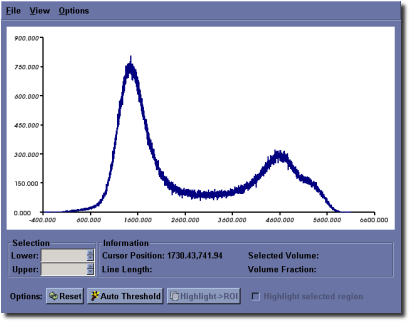
MicroView can plot a histogram of pixel values within a 2D or 3D ROI. To plot a histogram of data, first select an ROI, then press the g key to activate the histogram window. The control of the histogram window is similar to the control of the 2D profile plot window.
The histogram window has the following additional features:
- The Auto Threshold button can be used to automatically determine an optimal threshold value for use in the isosurface tool or Advanced Bone Analysis application. The value will be selected using the method of Otsu [2]. A red arrow will be displayed on the x-axis of the plot after hitting this button, indicating the threshold value. In addition, the window/level settings in MicroView will be adjusted to reflect this threshold value, as a convenience.
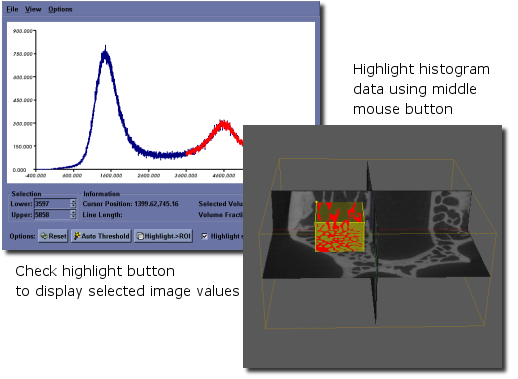
- The user can selectively interrogate a range of data within the histogram. For this selected range of values, the total number of voxels in the selected range and corresponding volume fraction are reported. To select a range of voxel values, place the cursor on the graph in the plot window and press the middle mouse button. Drag the mouse and release the button once the desired range of voxel values have been highlighted, in red. Check the Highlight selected region checkbox to adjust the image display in the 3D and all 2D viewports of the main window, so that voxels corresponding to the selected value range will be highlighted.
- Selected ranges can be converted to an active ROI by first highlighting a region, as described above, then clicking the Highlight ‣ ROI button. The highlighted red region will become yellow, indicating that the selected values are now the active ROI.
- The user can select different bin sizes for the histogram. Select from one of the menu entries under Options ‣ Bin Size to adjust the bin size.
Basic Bone Analysis Application
Overview
MicroView’s Basic Bone Analysis Application performs a variety of analysis upon a selected region of interest within an image. The application is designed specifically for analysis of CT images of bone. The choice of which functions to perform on a given ROI, can be selected prior to any calculation. The results could be stored or appended in user specified plain text files.
The Basic Bone Analysis Application contains the following analysis tools:
- BMD, which reports the bone mineral density (BMD), bone volume fraction (BVF), bone mineral content, and various other statistics;
- Stereology, which reports Euler index, bone volume fraction, bone surface to bone volume ratio, trabecular plate thickness, trabecular plate number, trabecular plate separation and various other measures. The Euler index is a measure of the connectivity of a trabecular structure.
Note
Our commercial package Advanced Bone Analysis Application contains analysis tools for SMI, Anisotropy, and Stereology. It also offers project and study management tools and support PDF and Excel outputs.
Using the Basic Bone Analysis Application
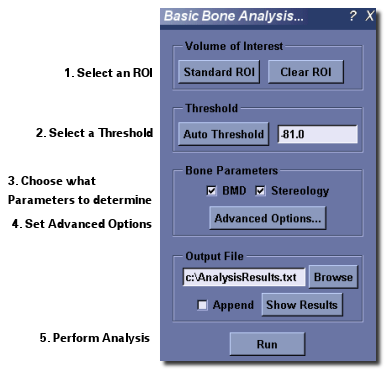
- Activate the Basic Bone Analysis Application by selecting Analyze ‣ Bone Analysis... from MicroView’s menu, or by clicking on the Bone Analysis button in the Applications group of MicroView’s toolbar.
- If an ROI has not already been selected, select one by clicking the Standard ROI button or by using any other ROI-generating tool.
- Once a ROI has been selected, enter a gray-level threshold value, that will be used to discriminate bone from none-bone voxels in the image. Either type in a threshold value in the entry field in the Threshold section or click the Auto Threshold button, to determine a best-guess threshold value automatically. If you would like to verify that the automatically selected value is appropriate, generate a histogram of the image contained within the ROI, then hit the Auto Threshold button on the histogram plot window.
- In the Bone Parameters section select the type of analysis desired. Click the Advanced Options... button to modify the default settings. The Advanced options will be discussed in more detail later in this section.
- In the Output File section select the name of the file where the results will be stored. The results are written to a plain text file. These results are presented for review after each successful execution. It is also possible to append the results to an existing text file by checking the Append checkbox button.
- Click the Run button to perform the analysis.
Advanced Options
The Advanced Options allows the user to modify the default settings. To display the Advanced Options dialog click the Advanced Options... button. In the Advanced Options dialog there are several tabs:
- The BMD tab has several variables that can be edited manually. By default the values for Bone ADU (arbitrary density unit) and Water ADU are set to the calibration constants found in the header of the currently loaded image file (not all file types support this). The Lower Exclusion ADU is a gray scale value below which voxels are not included in the bone equivalent mass calculation. Similarly the Upper Exclusion ADU is a Gray scale value above which voxels are not included in the bone equivalent mass calculation. The upper and lower exclusion ADU should be set to exclude air and metal, respectively, in the bone mass calculation.
- The Stereology tab, has an option to enable verbose output to display additional measures, and an option to enable the purify algorithm. To obtain meaningful results from Stereology, the image should be passed through this purification filter first. The purify algorithm removes spurious unconnected region.
- After all the modifications to the Advanced Options have been made, click the OK button to close the dialog.
Specific Tool Information
Bone Composition Measurement Tool
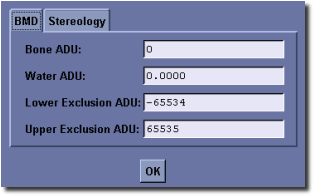
This tool performs a virtual biopsy and “ashing” to determine bone mineral content non-destructively. Image data derived from the Locus family of CT scanners may be calibrated to standard CT number, measured in Hounsfield Units (HU), and furthermore calibrated to permit determination of equivalent mass of hydroxyappetite. Results are reported as bone mineral fraction (BVF) or bone mineral density (BMD) in units of mg (HyAp)/cm3. To use this tool, launch the Advanced Bone Analysis application, define a 3D ROI, then select a threshold that discriminates bone from soft tissue. Prior to hitting the Run button, if required, click the Advanced Options... button to modify the BMD tool settings:
- Enter a value for Bone ADU
- Enter a value for Water ADU
- Enter a value for Lower Exclusion ADU
- Enter a value for Upper Exclusion ADU
Stereology Tool

MicroView can perform a simple stereology analysis of a 3D bone image. The stereology tool measures trabecular structure using similar techniques to those implemented in classical histomorphometry. 2D techniques determine estimates of trabecular thickness, spacing and density. At the same time, trabecular connectivity is quantified by calculating the Euler number for the trabecular structure. Finally, the bone surface area to volume ratio is also calculated.
To perform a stereology analysis on a CT image of a bone, launch the Advanced Bone Analysis application, define a 3D ROI, then select a threshold that discriminates bone from soft tissue. Prior to hitting the Run, if required, click the Advanced button to modify the Stereology tool settings:
Optionally click on the Enable Purify option to pass the selected image through a purification algorithm, first, before performing the stereology analysis. The purify algorithm removes isolated bony spicules and fills encapsulated marrow spaces. .. note:: When the purify algorithm is enabled, select an ROI where at least one of the voxels at
the boundary of the ROI is equal to or above the threshold (ie. the trabecular bone must intersect the boundaries of the ROI). Passing a clipped image, through the purify filter, which has no boundary voxels equal to or above the threshold will produce a blank image by the filter.
Optionally uncheck the Enable verbose output to disable the verbose output.
Report Generation
Overview
Analysis results generated by the Advanced Bone Application may be managed using MicroView’s report generation tool. The report generator saves all analysis information into an xml-based database, and allows for the retrieval, display and production of a final analysis report.

Basic Output Tool and Output Formats
Each of the different analysis tools in the Advanced Bone Application produces output data. The output data consists of information about each selected ROI’s parameters used to generate the output, as well as the final output measurement data. Data is maintained in a user-selected xml-based database. A simple spreadsheet-like tool can be used to review the results of the database, but further analysis is typically done once a report is generated from the results in the database. Four report output formats are available: raw text, CSV text file, Excel spreadsheet file, and PDF file.
Using the Spreadsheet Tool
The spreadsheet tool provides a simple view of the output data generated by the Advanced Bone Application. At the top of the view are tabs with labels corresponding to the different analysis tools in the Advanced Bone Application. The :guilabel:`ROI
Details` tab provides general information about the region of interest used to
generate the analysis. The other tabs provide the individual measurement data for each tool in a simple spreadsheet view. If there is no analysis data for a particular tool, the spreadsheet view for that tool is empty.
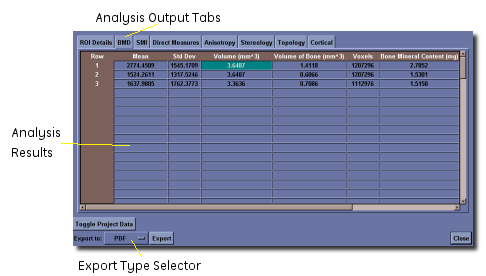
Three of the spreadsheet data tables have an additional dropdown control on them. These tables are for the Direct Measures, Stereology and Cortical tools. In each of these tables, there is additional data that is not shown in the default table view (Basic), but can be seen by selecting a different menu entry.
For the Direct Measures tools, the additional information that can be displayed is a histogram (bin counts) of the thickness and spacing data. For the Stereology, the additional information is the morphological data by axis. For the Cortical tool, the additional information is both the slice-by-slice detailed data, and the detailed thickness data.
At the bottom of the spreadsheet, there are a number of buttons and other controls, depending on the nature of the data being viewed. The first controls provide different options for exporting the data to a permanent file. The drop down provides a means to select the different export types - raw text, CSV text, Excel and PDF. After pressing the Export button, the user is prompted to enter a file name and the data will be saved in that file.
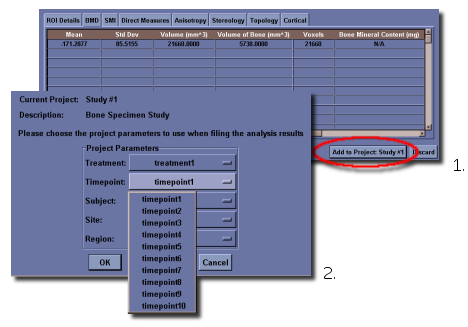
If the user wants to keep the data as part of a project, they may click on the Add to Project: project name button if they have an existing project. If there is no project loaded, this button will not appear. See below for details about project management.
If the analysis data will be kept as part of a project, the user is prompted to identify the project parameters that apply to this analysis. Once this is done, the user is presented with the spreadsheet view containing all of the data in the project. The data in this view can again be exported to any of the four file formats, but in this case, will include all of the different analyses that were performed as part of the project.
When viewing the entire project, a new button will appear (Toggle Project Data). In the default view, each entry in the project is simply assigned a line number. However, internally, the program remembers the project parameters that are associated with each entry. By pressing the Toggle Project Data button, the view changes so that the project parameters are explicitly shown in the spreadsheet table, or removes them from view if they are present.
The Discard button will throw away the current results and they are lost forever. If you want to export the results to another file, or keep them in a project, do not use Discard.
The Close button will close the spreadsheet view when looking at the data for the entire project. The data will be saved to the XML file, and can be viewed again using the Show Results button from the Advanced Bone Application window.
Projects
The output data generated by MicroView can be kept as part of a project. The project as implemented in MicroView has five axes. These are the treatment, timepoint, subject, site and region.
To define a project, click on the New Project button.
- Enter a project file name. The project file is stored in an XML file format.
- The project wizard will appear.
- Define the initial project parameters including the name, a description and the number of points on each study axis
- Enter the names for each axis point in the remaining windows of the wizard.
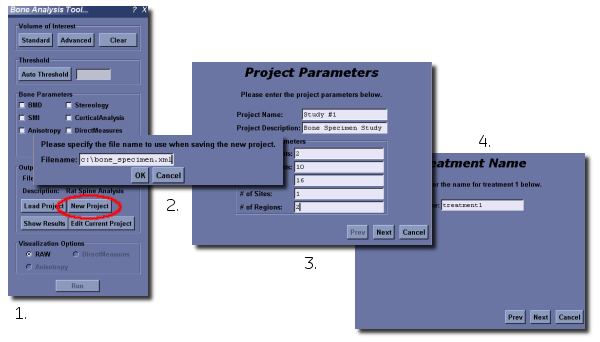
If there is an existing project in memory, the New Project button will unload that project, and allow the user to define a new project for immediate use.
It is possible to open an existing project using the Load Project button. Provided the project file has the correct format, it will be loaded, including all of the existing data in the file, and the project definition.
If you then click on the Edit Current Project button, the project wizard will appear and will already contain all of the parameters for the loaded project.
If you had opened an existing project, the Show Results button will show the data contained in the entire project using the spreadsheet viewer.
Once a project has been defined, when the user clicks on Add to Project: project name, a dialog will be displayed to allow the user to select the different project parameters to use when filing the output data. The window contains five drop down boxes in the dialog corresponding to the five study axes. By selecting the arrow at the right of the drop down, a list of all of the different point labels on that axes is presented and the user can select the appropriate values for the analysis being added to the project.
Understanding the Output Files
The different file types contain the data organized in different ways, and in some cases, may not contain all of the data that is available for analysis.
Text and CSV
The text and CSV files are organized in the same fashion, and simply use a different delimiter between the different data fields. In the case of the text file, it is tab delimited, while the CSV is clearly comma delimited.
All of the data fields are exported to the file. The file organizes the data output according to the tabs that appear in the spreadsheet viewer, so the ROI Details appear first, followed by BMD and so on. In the cases where there is additional data (Direct Measures, etc), the additional data begins on a new line within the section that it relates to. Each data section begins with a title, and a header row (including units) followed by the data row.
If the data exported is the entire project, then each section contains all of the data for the entire project and the lines begin with the project parameters for the specific line. Please note that respective lines may not match up from data section to data section, depending on whether a particular analysis was performed for a given project entry.
Excel
The Excel file is organized in a fashion that is nearly identical to the spreadsheet viewer in MicroView. Each tab in the spreadsheet view is given a separate worksheet in the Excel file. Further, the additional data components (Direct Measures, etc) are given their own worksheet. The rows are alternately highlighted to allow for easier separation of the data. The header rows are fixed so that they do not disappear when scrolling the data.
In the ROI Details worksheet, there is an additional column that contains a snapshot of the region of interest used to generate the data.
All of the points made in the Text and CSV section above regarding the organization of the rows for exporting data from the entire project also apply in this case for each worksheet.
PDF
The PDF file does not contain all of the available data, but presents a one or two page summary view of the data and is not meant for use for data analysis. The top of the page contains a large view of the snapshot of the region of interest that generated the data. After the snapshot is a table that contains selected data points from each of the different analyses that can be performed on the image data.
When exporting the data for an entire project to PDF, each different project entry will generate a separate report, contained in the same file. The data is thus separated, and cannot be compared easily.
Volume Rendering Tool
Overview
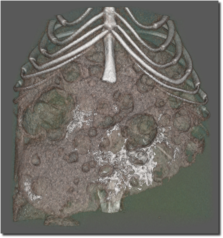
MicroView’s volume rendering tool can be used to produce stunning photo-realistic 2D semi-transparent representations of 3D image data by one of three raycast techniques. Raycast volume rendering is especially common in the medical imaging community where three dimensional volume data is easily available. To understand raycasting, think of voxels within a 3D image as possessing a density which corresponds to the graylevel value of the voxel. Imagine that for each pixel in the rendered image scene, a ray is drawn from the observer’s eye, through the image pixel, then through the entire 3D image data set. Each ray will intersect a number of voxels before leaving the 3D image data. For each image pixel in the rendered scene, a color is determined by accumulating information derived from the intersecting voxels along the corresponding raycast ray. In particular, for each voxel in the 3D image data, the “density” or graylevel value of the voxel will be transformed into a corresponding voxel color and transparency. This color and transparency information will be combined, according to a raycast function to determine the final pixel color in the image scene.
MicroView currently supports three styles of raycast volume rendering:
- Isosurface Rendering - a raycast method where surfaces of similar density objects are rendered, and the remaining materials are hidden. For this rendering mode, a density threshold value must be selected that defines the surface, and the color of the surface selected.
- Maximum Intensity Rendering - a method where the color of the densest object along each raycast path is used to determine the final color of each pixel. This method is particularly useful to extract, e.g. contrast-enhanced vessels, or bone from images.
- Composite Rendering - a general raycast method, which gives the greatest level of control over the raycast scene.
MicroView’s Rendering Interface
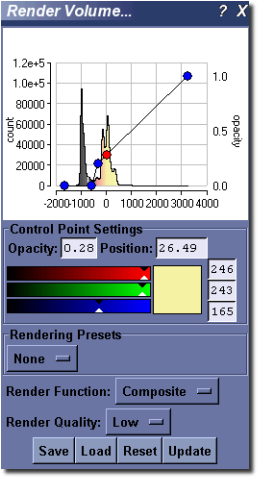
MicroView’s volume rendering interface allows the user to control the type of rendering to generate and the parameters that will be used to generate the rendering.
The interface consists of the following elements.
A graphical view that presents the image histogram, the opacity and color ramp and a representation of the LUT. The view can be controlled in the same fashion as the histogram or 2D profile plot windows. Additionally, this view contains a number of control points connected by a line. These control points are represented by either a blue (inactive) or red (active) dot and can be manipulated as outlined below.
Control Point Settings group. These controls allow the user to fine tune the specific values that are used for each control point in the opacity and color ramp.
A drop down box that contains a number of rendering presets. These presets have been designed to produce a good quality rendering in specific circumstances. There are two presents currently. - Bone - sets the threshold at the Bone HU value specified in the volume. - Soft tissue/Bone - uses the composite rendering method to generate an image that will
accurately represent both soft tissues and bones. The preset values have been chosen using the calibrated HU values for bone and soft tissues.
A pair of drop down boxes that are used to select the rendering mode to use, and the quality of the rendering to generate. The low quality rendering can be used to rapidly evaluate whether the chosen parameters will generate the desired image or not as the rendering is produced much more rapidly. Once the parameters have been roughly determined, the high quality rendering can be used to fine tune the results.
A group of buttons that provide the following functionality: - Save - saves all of the parameter settings to file for use at a later time or on another system. - Load - loads the parameter settings from a file generated using the Save function above. - Reset - Resets the histogram view and all of the associated parameters to the default values
for the selected rendering function. - Isosurface - the threshold value is set in the middle of the grayscale range of the
volume.
- Maximum Intensity Projection - three regions equally spaced in the grayscale range of the volume. The first region covers the smallest values and has an opacity of 0. The second region covers the middle third of the values and is a ramp from an opacity of 0 to an opacity of 1. The final region covers the highest values and has an opacity of 1.
- Composite - a ramp starting from the smallest grayscale value in the volume and an opacity of 0 to the largest grayscale value in the volume and an opacity of 1. There is a third control point at the middle grayscale value.
The interface is Reset whenever a new image is loaded into MicroView.
- Update - generate the volume rendering using the current settings. Manipulating the volume (rotation, slicing, magnification) has the same effect.
Using the Volume Renderer Tool
Select Visualize ‣ Render Volume... from the MicroView menu to open the volume rendering tool window.
Select the style of volume rendering desired. Composite rendering offers the greatest control over the display, but is the slowest form of rendering. MIP rendering displays a maximum intensity projection of the currently loaded image data. Isosurface rendering displays only the surface of objects, and is most useful for rendering bone images.
Change the location of the controls points if desired, to achieve the appropriate rendering result. The control points are chosen using the left mouse button and will change from blue to red to indicate that they are active. - Isosurface - there are two control points that are vertically connected. These control points
represent a threshold. All of the values above the threshold will be rendered. The two control points are always at the same graylevel.
Maximum Intensity Projection - there are four control points, of which two can be manipulated by changing the graylevel value where they are located. The opacity values are fixed for all of the control points. The two end points are fixed. The first end point is at the lowest graylevel value in the volume and has an opacity of 0. The second end point is at the highest graylevel value in the volume and has an opacity of 1. The two control points in the middle of the histogram can be moved back and forth to change their graylevel position, and thus the location and slope of the ramp function.
Composite - the composite rendering function is the most complicated and begins with three control points (two end points and the mid-point) and a ramp function from an opacity of 0 to an opacity of 1 as outlined above. The end points are fixed at the appropriate graylevel positions, but can have their opacity changed. There are a number of different manipulations that can be performed on the control points. - Adding a control point - move the mouse pointer over the line that does not have an existing
control point and click the left mouse button. A new point will appear at that location and will be active as indicated by the red coloration.
- Deleting a control point - select any existing control point by clicking on it with the left mouse button. The point will be marked active using the red coloration. Delete the point by pressing the “Del” key on your keyboard.
- Changing the opacity - select any existing control point by clicking on it with the left mouse button. By holding the left mouse button, it is possible to drag the control point up and down in the graphical view to change its opacity value. It is also possible to change the opacity of the currently selected control point by typing a value into the Opacity text entry box.
- Changing the graylevel position - select any existing control point by clicking on it with the left mouse button. By holding the left mouse button, it is possible to drag the control point left and right in the graphical view to changes is graylevel position. It is also possible to change the graylevel position of the currently selected control point by typing a value into the Position text entry box.
Change the color that each surface will appear by using the color editor. Begin by selecting any control point by clicking on it with the left mouse button and noting that its color changes from blue to red. The color can then be edited using either the sliders on the color bars or by entering a value in the appropriate text entry box. How the color change is applied depends on the type of rendering that is being generated. - Isosurface - all pixels above the specified threshold will be colored using the selected color. - Maximum Intensity Projection - the pixels above the active control point will be colored using
the selected color and the ramp function that joins the active control point to the next larger graylevel control point.
- Composite - same color treatment as the Maximum Intensity Project noted above.
Select quality of rendering. Choose “low” quality to render rapid, lower quality images. These low quality renderings can be used to quickly evaluate the results of any changes that are made to the parameters before generating the more time consuming high quality renderings. Choose “high” quality once opacity, and color tables have been correctly set, in order to render at the highest quality.
Click the Update button to update the output display whenever the rendering parameters have been adjusted. Manipulating the image by rotation, slicing or magnification will cause the output display to be updated.
Click the Reset button to restore the opacity and color transfer functions to their original default values.
Use the Save and Load buttons to save and load the parameter settings.
Additional MicroView Tools
MicroView has a number of additional features bundled into application plugins. Some of the core plugins are described below.
Reorient Image
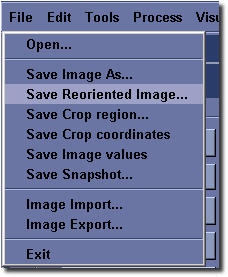
As discussed in earlier sections of this help guide, MicroView can perform arbitrary axis multiplanar reformatting of 3-D image data. Reorienting the displayed image planes is performed on-the-fly without actually adjusting the underlying image. To actually save the image reformatted along new axes, a specific image reorient tool in MicroView is used.
Note
Earlier releases of MicroView contained a “Reorient Image” plugin. This plugin has been replaced by a built-in method for reorienting an image. To save a reoriented image, first center and orient the cut planes in the 3-D view pane to represent the axes of the desired output image. Once satisfied with the displayed axes, select File ‣ Save Reoriented Image... to save the reoriented image to a file.
Standard ROI Tool
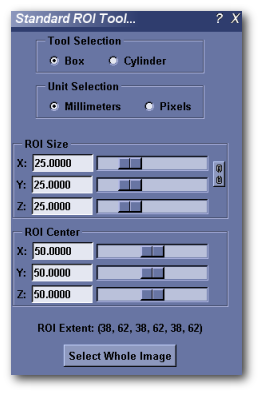
MicroView’s ROI tool can be used to select a 2D or 3D region of interest in the image for further analysis. It compliments the manual ROI selection technique, using the 7 and 8 keys. Use this tool when a ROI of a specific size or position is needed.
- Activate the ROI tool by selecting Standard ROI from the Tools and Applications sidebar on the left hand side of the main window, or by selecting Tools ‣ Standard ROI... from the main menu.
- Choose Parallelepiped or Elliptical Cylinder ROI shapes for the selected analysis region (Box and Cylinder options, respectively).
- Choose a unit of measurement – either millimeters or pixels.
- Adjust the size and position of the selected analysis region: Either manually enter coordinate values into the appropriate text boxes (hit enter key to accept changes), or adjust the sliders to the right of each entry box to choose the bounds of the region of interest.
- Alternatively, you can resize and reposition a rectangular ROI by interacting with the faces of the yellow box in the main 3D viewport. Position the mouse over any surface, then click and drag the middle mousebutton to resize the ROI along the axis parallel with the ROI face you clicked upon. Holding the shift key down, while performing the same operation will translate the ROI along the same axis.
.
Isosurface Tool
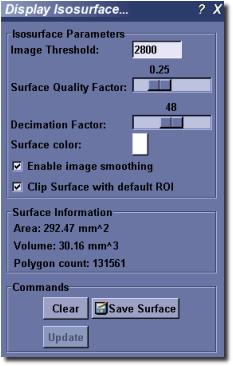
MicroView’s isosurface tool can be used to extract a surface from a 3D image that corresponds to a user-defined gray-level value. Activate the tool by selecting Visualize ‣ Isosurface... from the main menu. To use the tool:
- Select an image threshold value in the Image Threshold text box.
- Select a quality factor using the Surface Quality Factor slider. This factor is used to downsample the image prior, to extracting an isosurface. Use a small value (e.g. 0.25) initially to extract a course surface, then refine the surface by increasing the factor to 1.0. The memory consumed by this plugin increases quickly for large surface quality settings, as does the size of the final surface mesh. Use large values sparingly.
- Select a decimation factor by adjusting the appropriate slider. MicroView will attempt to reduce the surface complexity of the final isosurface by this user-defined amount. Setting a value of “0.1” means that MicroView will attempt to reduce the surface polygon count by 10%, while minimizing the impacting on surface topology, surface area and volume contained within the isosurface. A value of “0” indicates that no decimation shall be attempted, while values approaching “1” will significantly impact the quality of the final surface.
- Optionally enable image smoothing and image clipping by checking the appropriate checkboxes. If smoothing is enabled, MicroView will perform a Gaussian blur on the image prior to generating an isosurface. This is used commonly to reduce image noise, and hence remove spurious surface elements from the final surface. This will have an impact on the accuracy of the Area and Volume measurements displayed in the plugin GUI.
- Press the Update button to display/update the isosurface. Press the Clear to hide the surface.
Image Resample Tool
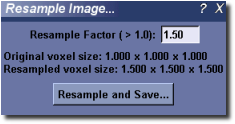
MicroView can perform image downsampling on a loaded image in order to decrease the disk space and memory needed to store an image. Activate the downsampling plugin by selecting Process ‣ Resample Image... from the main menu. Then:
- Enter a downsampling factor in the edit field.
- Press the Resample and Save... button to resample the image and save it to disk.
DICOM Data Transfer Tool
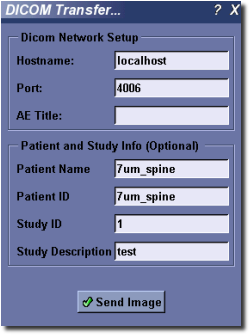
MicroView can use either of the CTN third-party command line tool send_image, or the DCMTK toolkit tool storescu to transfer a loaded image to a compatible DICOM viewing station.
To activate the tool, select Tools ‣ Dicom Transfer... from the main menu.
- Enter the hostname and port number of the destination server in the appropriate text entry boxes. Optionally select a DICOM application name, for servers that require communication from a specific application name. For servers that do not require a specific application name, leave this field blank.
- Check with your DICOM vendor, or user’s manual to determine what the AE title should be. Enter values for Patient Name, Patient ID, Study ID and Study Description, if needed. In some cases MicroView may be able to provide default values based on the image loaded.
- Finally, hit the Send Image button to transfer the image.
- To learn more about CTN and send_image, visit the CTN web site. To learn about DCMTK and storescu, visit the DCMTK web site.
Overlay Geometry
This tool is used to display and manipulate 3D surface geometry objects. Surface geometries can be read from a variety of common 3D file formats, such as STL, PLOT3D and PLY formats. Loaded geometries may be superimposed on top of the current 3D image data. Surface characteristics, such as color, opacity, and whether the object is displayed as a closed surface or a wire mesh can be adjusted for each loaded surface. Finally, each surface may be selected and assigned as the default ROI for MicroView. This permits advanced ROI selections to be saved and restored, as well as allowing third-party tools to be used to generate ROI objects.
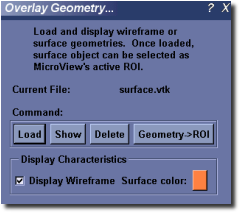
- Activate the Overlay Geometry plugin by selecting Visualize ‣ Overlay Geometry... from the main menu.
- Click the Load button to select a geometry file to load in. Multiple files can be loaded sequentially. Each surface object filename will be displayed in the list box above the Load button.
- Click the Show or Hide button to show or hide a selected geometry.
- Click the Delete button to remove a selected geometry from memory.
- Click the Geometry ‣ ROI button to assign the currently selected surface as the default ROI for MicroView.
- Customize the color of a selected surface by clicking on the surface’s color button, and adjust surface characteristics of the selected surface by checking or unchecking the Display Wireframe button.
- Customize the opacity of the selected surface by adjusting the opacity slider. A value of zero means the surface is completely transparent (e.g. invisible), while a value of 1.0 indicates the surface is completely opaque.
Image Information
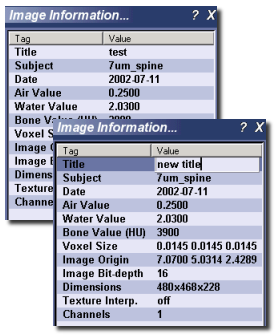
This plugin displays information about the image that is currently loaded. The plugin can be activated by selecting Tools ‣ Image Information... from the main menu. Some displayed information may be blank, depending on the image type, and the available information within the image header. Some fields are specific to vff format images, especially those generated by the Locus reconstruction software package: Air and water parameters, for instance, correspond to calibration values entered using the CT calibration tool in MicroView. Similarly, the bone parameter value (measured in Hounsfield Units), is also a calibration value, determined as part of the Locus image reconstruction process.
Some image information values (title, subject, air, water and bone values) may be edited by clicking on the value field in the image information box. Press the Enter key to accept the new value, or press the Escape key to cancel your edit session. Editing values in this way does not modify the contents of the original image file on disk – you must explicitly save the image in order to preserve your changes.
.
.
CT Calibration Tool
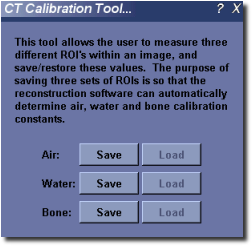
This plugin allows the user to measure three different ROI’s within an image, and save/restore these values. The purpose of saving three sets of ROIs is so that the reconstruction software can automatically determine air, water and bone calibration constants.
- Activate the CT Calibration plugin by selecting Tools ‣ CT Calibration Tool... from the main menu.
- Define a ROI with only air by using either the 7/8 keys,or by selecting a ROI using the ROI plugin (Plugins ‣ ROI Selection Tool... on the MicroView menu) and click the corresponding Save button. Similarly do the same for water and bone.
- Once the ROI’s for air, water, and bone have been selected and the settings have been saved, click one of the Load buttons and the corresponding ROI will appear.
Make Movie
Note
The Movie Maker plugin is now supported on all platforms. Previous releases of MicroView had support only for the Windows version. MovieMaker supports the creation of both AVI and MPEG format movies. These movies can be generated on any platform, and played back on any platform and are useful for inclusion in presentations and other rich media applications.
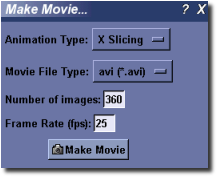
This plugin allows the user to make a movie of a sequence of screen snapshots, while the loaded image is either rotated 360 degrees about an axis, or sliced along a cutplane. Select Visualize ‣ Make Movie... to load the movie maker. Next:
- Select the type of animation desired in the Animation Type drop-down menu. The X/Y/Z Rotation entries correspond to animations of the image scene while rotating the image about the selected axis. The X/Y/Z Slicing entries generate an animation of the image scene while slicing through the entire image along the selected image axis.
- Select from one of a number of movie file types.
- Enter the number of snapshot images to take while generating the movie. For rotation-type movies, this number will determine how many degrees to rotate the image scene between each image and the next.
- Finally, click the Make Movie button to select an output filename, and to start making the movie.
Measurement Tool
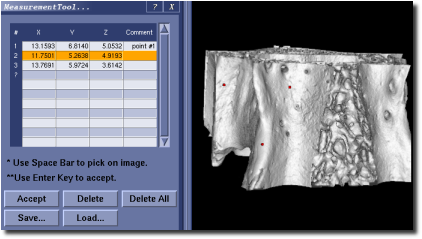
MicroView’s measurement tool is used to make a set of landmark measurements on an image, and to save these measurements to disk. Start the tool by selecting Plugins ‣ Measurement... from the main menu. Once loaded:
- Position the mouse cursor over a point of interest in either 3D or 2D viewports
- Press the spacebar to place a marker at the current mouse position
- Press the Accept button, or Enter key, to permanently accept the marker position, or reposition the mouse and hit the spacebar again to move the marker
- For each marker, the 3D coordinate will be recorded in the table contained in the measurement tool. The Fourth column is reserved for adding comments to each line
- Press the Save... to save the current marker positions to disk
Frequently Asked Questions
Where can I download the latest version of MicroView?
Here.
Where can I get source code for MicroView and instructions on how to build it?
The source is available from the MicroView sourceforge `git repository <http://sourceforge.net/scm/?type=git&group_id=69063>_.
Is MicroView available for Mac OS X?
Note
Yes. With the release of MicroView 2.1, Mac OS X is fully supported. In particular, MicroView’s movie maker and volume renderer are now supported on all platforms.
How can I automatically threshold a loaded image in MicroView?
MicroView can automatically select an optimal threshold value by examining a histogram of pixel values in a user defined region of interest. This value is useful as input to the isosurface, stereology, and volume rendering plugins. To automatically threshold an image, first select a region of interest, using either the ROI plugin or the 7/8 keys. Next, generate a histogram of the pixel values within this region of interest by hitting the g key. Finally, click on the Auto Threshold button on the histogram plot window to automatically determine an optimal threshold. MicroView’s automatic thresholding is based upon the “Otsu” method [2].
When selecting Image Export from the File menu, the only option that comes up for export is DICOM (no jpeg or other file format options). Is this option no longer being offered in the current version of MicroView or do I need to do something else to convert my .vff file into jpeg slices?
The image export feature gives a list of appropriate file formats, depending on the image depth of the image you’ve loaded. If, for instance, you have a 16-bit image, only DICOM format will be available. For 8-bit images, different formats will be available, including jpeg, png, gif, etc. To handle the export of 16-bit images to formats such as jpeg, you need to first rescale the images to 8-bit. Under the Process menu, select Image Downsample in order to convert your image from 16-bit to 8-bit, then select Image Export from the File menu.
How do I make movies in MicroView?
MicroView has a rudimentary movie making facility, which permits generation of movies. For more complex movie making, there are numerous screen capture applications that can export to e.g. AVI movies. One such utility is hypercam .
Is MicroView scriptable?
Yes. There is a document at the sourceforge website that describes how to write scripts for MicroView. Go to the URL http://microview.sourceforge.net and click the link “Documentation” in the top left corner. Then click the “MicroView Scripting HOWTO” link.
What is the format of the ABA xml database format?
The Advanced Bone Application xml database format specification is maintained as an xml Document Type Definition file (DTD). The database format specification can be found here.
Copyright Notice
MicroView is based on a number of Open Source software packages. Individual copyright and license statements from their respective owners follow.
GE Healthcare Copyright
Copyright (c) 2000-2009 GE Healthcare.
Use, modification and redistribution of the software, in source or
binary forms, are permitted provided that the following terms and
conditions are met:
1) Redistribution of the source code, in verbatim or modified
form, must retain the above copyright notice, this license,
the following disclaimer, and any notices that refer to this
license and/or the following disclaimer.
2) Redistribution in binary form must include the above copyright
notice, a copy of this license and the following disclaimer
in the documentation or with other materials provided with the
distribution.
3) Modified copies of the source code must be clearly marked as such,
and must not be misrepresented as verbatim copies of the source code.
EXCEPT WHEN OTHERWISE STATED IN WRITING BY THE COPYRIGHT HOLDERS AND/OR
OTHER PARTIES, THE COPYRIGHT HOLDERS AND/OR OTHER PARTIES PROVIDE THE
SOFTWARE "AS IS" WITHOUT EXPRESSED OR IMPLIED WARRANTY INCLUDING, BUT
NOT LIMITED TO, THE IMPLIED WARRANTIES OF MERCHANTABILITY AND FITNESS
FOR A PARTICULAR PURPOSE.  IN NO EVENT UNLESS AGREED TO IN WRITING WILL
ANY COPYRIGHT HOLDER OR OTHER PARTY WHO MAY MODIFY AND/OR REDISTRIBUTE
THE SOFTWARE UNDER THE TERMS OF THIS LICENSE BE LIABLE FOR ANY DIRECT,
INDIRECT, INCIDENTAL OR CONSEQUENTIAL DAMAGES (INCLUDING, BUT NOT LIMITED
TO, LOSS OF DATA OR DATA BECOMING INACCURATE OR LOSS OF PROFIT OR
BUSINESS INTERRUPTION) ARISING IN ANY WAY OUT OF THE USE OR INABILITY TO
USE THE SOFTWARE, EVEN IF ADVISED OF THE POSSIBILITY OF SUCH DAMAGES.
Atamai Inc. License
Portions of MicroView are based on code provided by Atamai Inc. The Copyright and license statement follows:
Copyright (c) 2000 Atamai, Inc.
Use, modification and redistribution of the software, in source or
binary forms, are permitted provided that the following terms and
conditions are met:
1) Redistribution of the source code, in verbatim or modified
form, must retain the above copyright notice, this license,
the following disclaimer, and any notices that refer to this
license and/or the following disclaimer.
2) Redistribution in binary form must include the above copyright
notice, a copy of this license and the following disclaimer
in the documentation or with other materials provided with the
distribution.
3) Modified copies of the source code must be clearly marked as such,
and must not be misrepresented as verbatim copies of the source code.
THE COPYRIGHT HOLDERS AND/OR OTHER PARTIES PROVIDE THE SOFTWARE "AS IS"
WITHOUT EXPRESSED OR IMPLIED WARRANTY INCLUDING, BUT NOT LIMITED TO,
THE IMPLIED WARRANTIES OF MERCHANTABILITY AND FITNESS FOR A PARTICULAR
PURPOSE.  IN NO EVENT SHALL ANY COPYRIGHT HOLDER OR OTHER PARTY WHO MAY
MODIFY AND/OR REDISTRIBUTE THE SOFTWARE UNDER THE TERMS OF THIS LICENSE
BE LIABLE FOR ANY DIRECT, INDIRECT, INCIDENTAL OR CONSEQUENTIAL DAMAGES
(INCLUDING, BUT NOT LIMITED TO, LOSS OF DATA OR DATA BECOMING INACCURATE
OR LOSS OF PROFIT OR BUSINESS INTERRUPTION) ARISING IN ANY WAY OUT OF
THE USE OR INABILITY TO USE THE SOFTWARE, EVEN IF ADVISED OF THE
POSSIBILITY OF SUCH DAMAGES.
VTK Copyright
Copyright (c) 1993-2008 Ken Martin, Will Schroeder, Bill Lorensen
All rights reserved.

Redistribution and use in source and binary forms, with or without
modification, are permitted provided that the following conditions are met:

 * Redistributions of source code must retain the above copyright notice,
   this list of conditions and the following disclaimer.

 * Redistributions in binary form must reproduce the above copyright notice,
   this list of conditions and the following disclaimer in the documentation
   and/or other materials provided with the distribution.

 * Neither name of Ken Martin, Will Schroeder, or Bill Lorensen nor the names
   of any contributors may be used to endorse or promote products derived
   from this software without specific prior written permission.

THIS SOFTWARE IS PROVIDED BY THE COPYRIGHT HOLDERS AND CONTRIBUTORS ``AS IS''
AND ANY EXPRESS OR IMPLIED WARRANTIES, INCLUDING, BUT NOT LIMITED TO, THE
IMPLIED WARRANTIES OF MERCHANTABILITY AND FITNESS FOR A PARTICULAR PURPOSE
ARE DISCLAIMED. IN NO EVENT SHALL THE AUTHORS OR CONTRIBUTORS BE LIABLE FOR
ANY DIRECT, INDIRECT, INCIDENTAL, SPECIAL, EXEMPLARY, OR CONSEQUENTIAL
DAMAGES (INCLUDING, BUT NOT LIMITED TO, PROCUREMENT OF SUBSTITUTE GOODS OR
SERVICES; LOSS OF USE, DATA, OR PROFITS; OR BUSINESS INTERRUPTION) HOWEVER
CAUSED AND ON ANY THEORY OF LIABILITY, WHETHER IN CONTRACT, STRICT LIABILITY,
OR TORT (INCLUDING NEGLIGENCE OR OTHERWISE) ARISING IN ANY WAY OUT OF THE USE
OF THIS SOFTWARE, EVEN IF ADVISED OF THE POSSIBILITY OF SUCH DAMAGE.
ITK Copyright
Copyright (c) 1999-2003 Insight Software Consortium
All rights reserved.

License:

Redistribution and use in source and binary forms, with or without
modification, are permitted provided that the following conditions are met:

        * Redistributions of source code must retain the above copyright notice,
          this list of conditions and the following disclaimer.

        * Redistributions in binary form must reproduce the above copyright notice,
          this list of conditions and the following disclaimer in the documentation
          and/or other materials provided with the distribution.

        * Neither the name of the Insight Software Consortium nor the names of its
          contributors may be used to endorse or promote products derived from this
          software without specific prior written permission.

THIS SOFTWARE IS PROVIDED BY THE COPYRIGHT HOLDERS AND CONTRIBUTORS "AS IS" AND
ANY EXPRESS OR IMPLIED WARRANTIES, INCLUDING, BUT NOT LIMITED TO, THE IMPLIED
WARRANTIES OF MERCHANTABILITY AND FITNESS FOR A PARTICULAR PURPOSE ARE
DISCLAIMED. IN NO EVENT SHALL THE COPYRIGHT OWNER OR CONTRIBUTORS BE LIABLE FOR
ANY DIRECT, INDIRECT, INCIDENTAL, SPECIAL, EXEMPLARY, OR CONSEQUENTIAL DAMAGES
(INCLUDING, BUT NOT LIMITED TO, PROCUREMENT OF SUBSTITUTE GOODS OR SERVICES;
LOSS OF USE, DATA, OR PROFITS; OR BUSINESS INTERRUPTION) HOWEVER CAUSED AND ON
ANY THEORY OF LIABILITY, WHETHER IN CONTRACT, STRICT LIABILITY, OR TORT
(INCLUDING NEGLIGENCE OR OTHERWISE) ARISING IN ANY WAY OUT OF THE USE OF THIS
SOFTWARE, EVEN IF ADVISED OF THE POSSIBILITY OF SUCH DAMAGE.
PIL Copyright
The Python Imaging Library (PIL) is

        Copyright © 1997-2011 by Secret Labs AB
        Copyright © 1995-2011 by Fredrik Lundh

By obtaining, using, and/or copying this software and/or its associated
documentation, you agree that you have read, understood, and will comply
with the following terms and conditions:

Permission to use, copy, modify, and distribute this software and its associated
documentation for any purpose and without fee is hereby granted, provided that the
above copyright notice appears in all copies, and that both that copyright notice
and this permission notice appear in supporting documentation, and that the name
of Secret Labs AB or the author not be used in advertising or publicity pertaining
to distribution of the software without specific, written prior permission.

SECRET LABS AB AND THE AUTHOR DISCLAIMS ALL WARRANTIES WITH REGARD TO THIS
SOFTWARE, INCLUDING ALL IMPLIED WARRANTIES OF MERCHANTABILITY AND FITNESS. IN NO
EVENT SHALL SECRET LABS AB OR THE AUTHOR BE LIABLE FOR ANY SPECIAL, INDIRECT OR
CONSEQUENTIAL DAMAGES OR ANY DAMAGES WHATSOEVER RESULTING FROM LOSS OF USE, DATA OR
PROFITS, WHETHER IN AN ACTION OF CONTRACT, NEGLIGENCE OR OTHER TORTIOUS ACTION,
ARISING OUT OF OR IN CONNECTION WITH THE USE OR PERFORMANCE OF THIS SOFTWARE.
Numpy Copyright
Copyright (c) 2005, NumPy Developers

All rights reserved.

Redistribution and use in source and binary forms, with or without
modification, are permitted provided that the following conditions are
met:

* Redistributions of source code must retain the above copyright
  notice, this list of conditions and the following disclaimer.

* Redistributions in binary form must reproduce the above
  copyright notice, this list of conditions and the following
  disclaimer in the documentation and/or other materials provided
  with the distribution.

* Neither the name of the NumPy Developers nor the names of any
  contributors may be used to endorse or promote products derived
  from this software without specific prior written permission.

THIS SOFTWARE IS PROVIDED BY THE COPYRIGHT HOLDERS AND CONTRIBUTORS
"AS IS" AND ANY EXPRESS OR IMPLIED WARRANTIES, INCLUDING, BUT NOT
LIMITED TO, THE IMPLIED WARRANTIES OF MERCHANTABILITY AND FITNESS FOR
A PARTICULAR PURPOSE ARE DISCLAIMED. IN NO EVENT SHALL THE COPYRIGHT
OWNER OR CONTRIBUTORS BE LIABLE FOR ANY DIRECT, INDIRECT, INCIDENTAL,
SPECIAL, EXEMPLARY, OR CONSEQUENTIAL DAMAGES (INCLUDING, BUT NOT
LIMITED TO, PROCUREMENT OF SUBSTITUTE GOODS OR SERVICES; LOSS OF USE,
DATA, OR PROFITS; OR BUSINESS INTERRUPTION) HOWEVER CAUSED AND ON ANY
THEORY OF LIABILITY, WHETHER IN CONTRACT, STRICT LIABILITY, OR TORT
(INCLUDING NEGLIGENCE OR OTHERWISE) ARISING IN ANY WAY OUT OF THE USE
OF THIS SOFTWARE, EVEN IF ADVISED OF THE POSSIBILITY OF SUCH DAMAGE.
Appendix A - Supported File Formats
Supported Image File Formats
This is a partial list of image formats that MicroView can read and/or write:
- VFF - SUN TAAC file format
- DCM - DICOM version 3.0, part 10 image format
- VTK - The Visualization Tool Kit image format
- PPM/PBM/PGM - Portable pixmap/bitmap/graymap image format
- JPG - jpeg image format
- PNG - Portable network graphics format
- BMP - Windows bitmap file format
- TIFF - Tagged image file format (uncompressed, 8-bit format only)
- HDR/IMG - Analyze image format
- MNC - MINC image format
- NFO/RAW - A simple raw image format
- Interfile - A Nuclear medicine file format
- MHA/MHD - UNC meta image data
Supported Geometry File Formats
Appendix B - Memory performance of MicroView under 32-bit Windows
MicroView memory performance can be improved by running under certain version of Windows operating systems, where the large memory aware boot option is available. Windows XP Professional and Windows 2003 versions both support this boot option. The method for increasing available memory for MicroView involves modification of the file C:\boot.ini to add “/3GB /PAE” to the boot line:
Log on as a user with Administrative privileges
Select Start ‣ Settings ‣ Control Panel ‣ System ‣ Advanced ‣ (Startup and Recovery) Settings, then click the “Edit” button.
Duplicate the first line under [operating systems]
Change the name of the new entry (the text between quotes), then add a “/3GB /PAE” switch at the end of the line.
Save and Exit. The file should look something like the following:
\[boot loader]
timeout=5
default=multi(0)disk(0)rdisk(0)partition(1)\\WINNT
\[operating systems]
multi(0)disk(0)rdisk(0)partition(1)\\WINNT="Microsoft Windows XP Professional" /fastdetect
multi(0)disk(0)rdisk(0)partition(1)\\WINNT="Microsoft Windows XP Professional" /fastdetect /3GB /PAE
Reboot your computer. As your computer boots, a screen will be displayed giving you the choice of selecting between different boot options. Select the new boot option corresponding to the name you entered in C:\boot.ini. Once the computer finishes booting, you will be able to take advantage of up to 3GB of virtual memory in each instance of MicroView, rather than the default of 2GB.
Appendix C - MicroView’s support for Raw image data
MicroView reads and writes a variety of 2D and 3D image formats, summarized in the appendix above. In particular, the ”.nfo” image format is a simple format that can be easily used to import and export raw images with MicroView. It is a two-file format that consists of a raw image, contained in a file named something like rawfile.img, and a text-based header file with the same base name, but with a ”.nfo” extension (i.e. rawfile.nfo). Header files are simple ascii text files, that contain a set of name-value pairs, separated by a colon, one pair per line of the file.
An example header file is listed below:
width: 336
height: 283
numFrames: 160
shear_angle(rad): 0.000000
xVoxelSize: 0.1
yVoxelSize: 0.1
zVoxelSize: 0.2
dataType: 4
This header file describes a 336x283x160 raw image with voxels that are 0.1mm x 0.1mm x 0.2mm in dimension. The shear_angle(rad) entry should be present in the header, but is ignored by MicroView – it can safely be set to zero. The dataType entry defines the numeric type of the data contained within the raw image file, rawimage.img. The value should be selected from the table below:
Image Datatype codes
| Function | Description |
|---|---|
| 2 | Signed 8-bit char |
| 3 | Unsigned 8-bit char |
| 4 | Signed 16-bit short integer |
| 5 | Unsigned 16-bit short integer |
| 8 | Signed long integer |
| 9 | Unsigned long integer |
| 10 | Floating-point data |
Given a raw image for import, first rename the file to have an extension of ”.img”. Determine the image dimensions, voxel size and image format. Using the text editor of your choice, create a corresponding header file with the same base name, but an ”.nfo” extension. Copy and edit the entries listed Example 1 into this file, customize to match your image and save. Load MicroView and select the ”.nfo” for reading.
Bibliography
| [1] | A Odgaard and HJG Gundersen. “Quantification of Connectivity in Cancellous Bone, with Special Emphasis on 3-D Reconstructions”. Bone. 14. 113-152. 1993. |
| [2] | (1, 2) N Otsu. “A threshold selection method from gray-level histograms”. IEEE Trans. Systems, Man, and Cybernetics. 9(1). 62-66. 1979. |
| [3] | T Hildebrand and P Rüegsegger. “Quantification of bone microarchitecture with the structure model index”. Comp Meth Biomech Biomed Eng 1. 15-23. 1997. |
| [4] | T Hildebrand and P Rüegsegger. “A new method for the model-independent assessment of thickness in three-dimensional images”. J Microsc 185. 67-75. 1997. |
| [5] | WJ Whitehouse. “The quantitative morphology of anisotropic trabecular bone”. J Microsc 101. 153-168. 1974. |
| [6] | TP Harrigan and RW Mann. “Characterization of microstructural anisotropy in orthotropic materials using a second rank tensor”. J Mat Sci 19. 761-767. 1984. |